
This research seeks to investigate a data set collected from data.gov. An official website for Technology Transformation Services (TTS) of the General Services Administration, that collects data for the USA.
The data being collected is about Los Angeles Police Department (LAPD) Crime Data from 2020 to November 29, 2025.
https://catalog.data.gov/dataset/crime-data-from-2020-to-present
This dataset reflects incidents of crime in the City of Los Angeles dating back to 2020. This data is transcribed from original crime reports that are typed on paper and therefore there may be some inaccuracies within the data. Some location fields with missing data are noted as (0°, 0°). Address fields are only provided to the nearest hundred block in order to maintain privacy. This data is as accurate as the data in the database (Data.gov, 2025).
The reason for writing this research will be enriching academically by both writing about such a topic that is personally interesting and doing some statistical analysis for the excel sheet that is being provided.
Introduction
Crime and public safety are critical issues facing communities across the United States. By analysing the patterns behind criminal activity, policymakers and community leaders can develop more effective strategies to prevent crime, allocate resources, and promote safer communities (Ire Alarape; Eyob Dagnachew & Tchegnon Adjagbodjou, 2024).
The mission of the Los Angeles Police Department is to safeguard the lives and property of the people they serve, to reduce the incidence and fear of crime, and to enhance public safety while working with the diverse communities of Los Angeles to improve their quality of life. The Department’s goal is to do so with honor and integrity, while conducting themselves with the highest ethical standards to maintain public confidence.
The highly skilled and expertly trained officers of the LAPD possess the knowledge, ability, and experience necessary to identify and minimize threats to public safety (LAPF Foundation).
Figure 1. Geographic Distribution of Crime
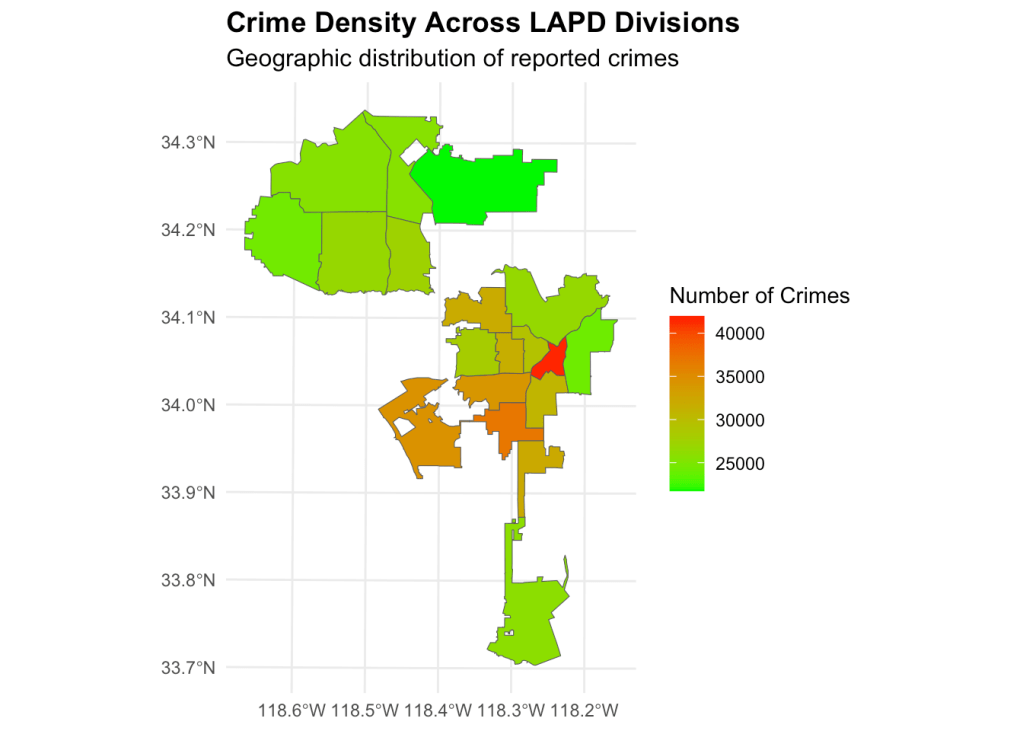
(Ire Alarape; Eyob Dagnachew & Tchegnon Adjagbodjou, 2024).
The US crime rate has been trending downward for decades, including in 2024. While crime rates constantly fluctuate, overall violent crime and property crime rates are both at their lowest points since 1976, the earliest year of available data.
State-by-state, though, crime rates vary because of factors like urbanization levels, economic conditions, and law enforcement effectiveness (US Facts, 2025).
The Federal Bureau of Investigation’s (FBI) Uniform Crime Reporting (UCR) program classifies violent crimes as those involving force or the threat of force. They are categorized into four specific offenses: murder and nonnegligent manslaughter, rape, robbery, and aggravated assault.
The UCR defines property crime as a crime during which someone takes money or property without using force or threats. Property crimes include burglary, larceny-theft, and motor vehicle theft (US Facts, 2025).
Figure 2. Reported violent crimes per 100,000 people by state, 2024
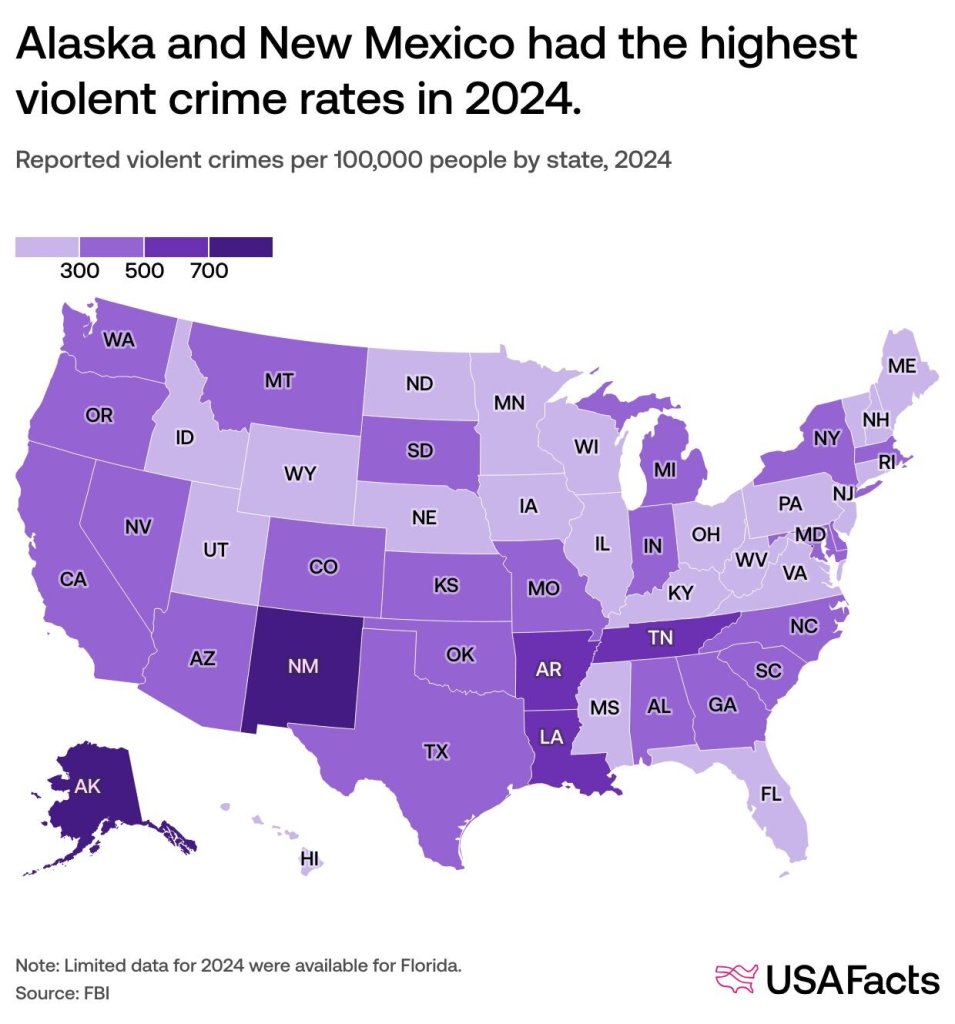
(US Facts, 2025)
Figure 3. National crime rates since 1976
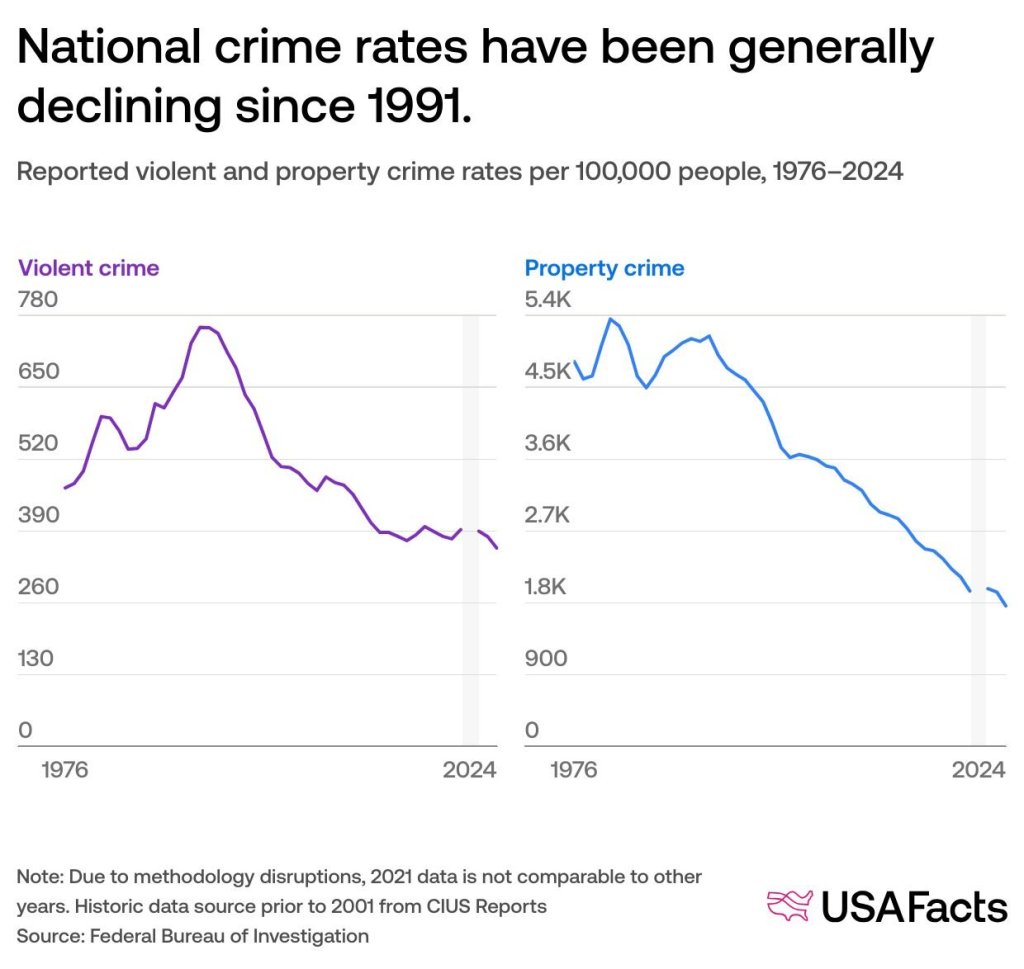
(US Facts, 2025)
In 2023 the state of California, that contains the city of Los Angeles had reported 1,104,212 total crimes, making it the highest state in total crime rate of the USA.
It consisted of 198,036 violent crimes; such as homicide of 1,929, rape 14,190 , robbery 49,977 and others.
The non violent crimes were reported 906,176 with larceny which is Stealing without using force, threats or breaking count being the highest 571,215 (World Population Review, 2025).
Figure 4. Change in violent crime, 2019-2024
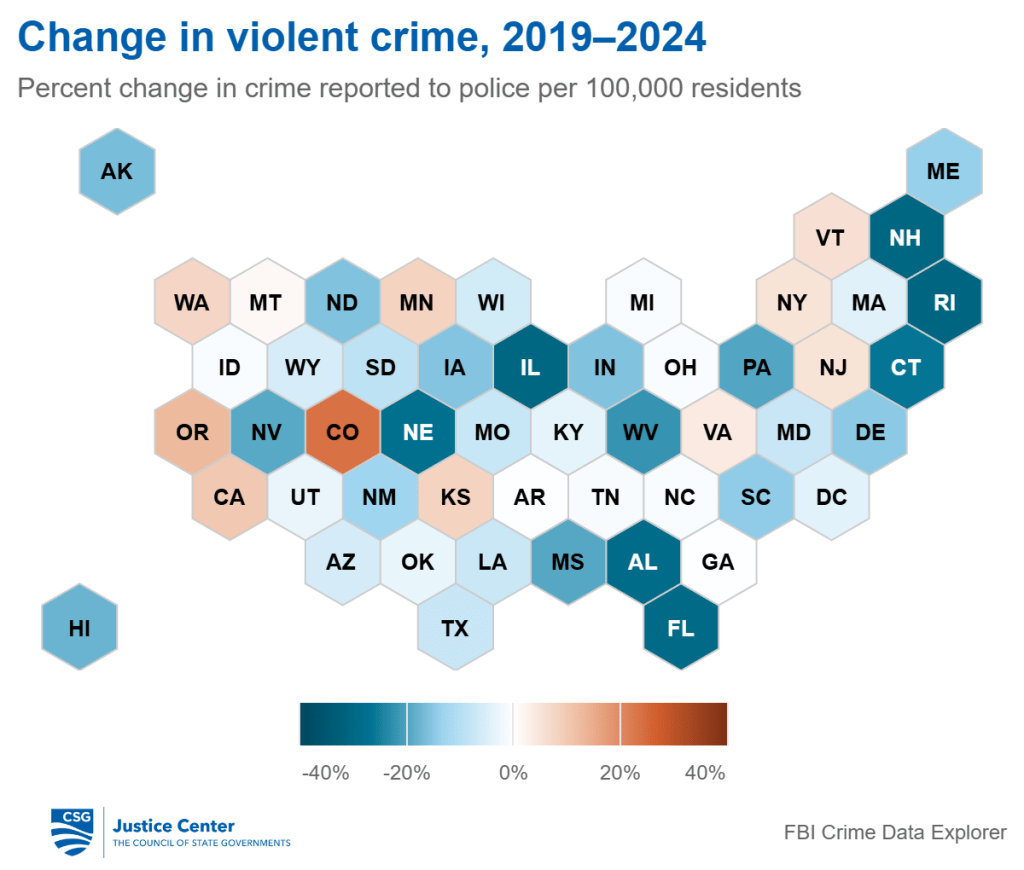
In 2024, 44 percent of violent crime incidents reported to police in the United States were solved. The percentage of violent crimes that law enforcement solved fell from 2019 to 2022 and increased in 2024 to its highest level since 2015 (Justice Center, 2024).
Figure 5. Solve rate of violent crimes
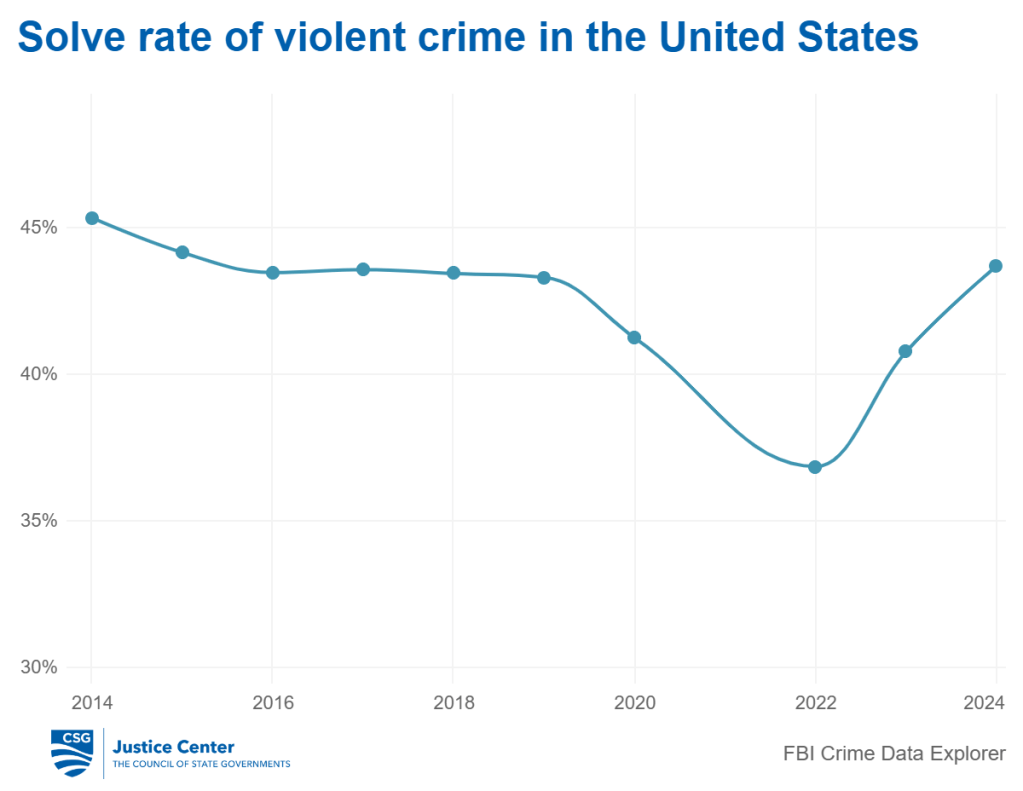
The percentage of solved violent crimes from 2019 till 2024 was up by 10% in California reaching 43%, making it one of the highest states of solved violent crimes in the USA (Justice Center, 2024).
Data Set Explanation
This data includes a set of variables, which some can be obvious such as Vict Age, that is the age of the victim when the crime took place. But others need a bit of explanation.
1- DR_NO: A unique identification number assigned to each specific reported crime (Open Data Bay, 2025). It is an official number, consisting of 2-digit year, area ID, and 5 digits.
2- Date Rptd: The date on which the crime was reported to authorities; not when it took place (Open Data Bay, 2025). The date the crime was reported, in MM/DD/YYYY format.
3- Date OCC: The date when the crime took place in the same format as Date Rptd (Open Data Bay, 2025). Sometimes there could be a delay between Date OCC and Date Rptd; because the victim delayed their report whether out of fear or not knowing the crime took place if it was a burglary, fraud, etc. A delay could occur because the information had entered the system later, some incidents require an internal investigation to make sure the crime had happened so it will not be reported until a confirmation, other cases such as childhood abuse could be reported when the victim turned to adult so a delay might be in years.
4- Time OCC: The time the crime occurred, represented in 24-hour military time (Open Data Bay, 2025).
5- Rpt Dist No: Reported district number, a four-digit code for the sub-area within a Geographic Area where the crime occurred (Open Data Bay, 2025).
6- Part 1-2: A classification code for the crime (Open Data Bay, 2025). Crimes are classified into Part 1 Crime and Part 2 Crime.
Part 1 Crime are usually the more serious dangerous crimes, they fall within these categories:
- Criminal homicide (murder / non-negligent manslaughter)
- Forcible rape
- Robbery
- Aggravated assault
- Burglary (breaking-and-entering / home or other structures)
- Larceny–theft (theft without force, e.g. shoplifting, pickpocketing)
- Motor vehicle theft (theft of cars, trucks, motorcycles)
- Arson (willful/malicious burning of property)
(FBI, 2012).
Part 2 Crimes are all other offenses that are not classified as Part 1;
- Forgery / counterfeiting
- Fraud, embezzlement, other financial / property-related crimes (non-violent theft, bad checks, etc.)
- Vandalism / property damage (non-arson)
- Drug-related offenses (possession, abuse)
- Weapons violations (possession of illegal weapons)
- Prostitution, non-forcible sex offenses, crimes against family/children, DUI / liquor law violations, gambling, disorderly conduct, etc.
(FBI, 2014)
7- Crm Cd: Short for Crime Code, is the code numerically that fits the description of which type of crime it was, usually followed by crime coded description which the description in words. It might be supported by crime code 2, 3 and so on; because a single crime can have more than one offense, crime code 1 usually is the most dangerous one.
8- Mocodes: Modus Operandi codes describing activities associated with the suspect during the crime (Open Data Bay, 2025). Modus Operandi “way of operating”: “MO” is Latin for modus operandi. The Mocodes field encodes information about the suspect’s method or behavior during the crime (e.g. “shots fired,” “use of vehicle,” “gang-related,” “multiple suspects,” etc.). A single incident may have multiple MO codes — indicating more than one relevant modus operandi or characteristic behavior involved. MOcodes are usually 4-digit numeric (or string) codes.
9- Status Desc: The current description of the investigative status of the reported crime (e.g., Invest Cont – Investigation Continuing, Adult Other- The incident involves an adult, but the outcome was not an arrest and vice versa for adult arrest, same pattern continues for Juv Arrest or Other with Juv representing a Juvenile). (Open Data Bay, 2025).
Methodology:
The methodology that is used for this research was based on doing statistical programming codes, specifically for data analysis, and visualization.
The codes were done on the software R (or the R programming language) version 4.5.2.
Link to download the program “https://cran.r-project.org/bin/windows/base/”
The codes involved descriptive statistics such as standard deviation, variance, mean..etc
Frequency tables, histograms, stacked bar plots, Chi-square test of independence, Cramer’s V (strength of association), time base analysis, heatmaps, probability of crimes, high risk time periods and scatter maps based on the Latitude and Longitude for certain crimes.
Results
Figure 6. Histogram of victim age
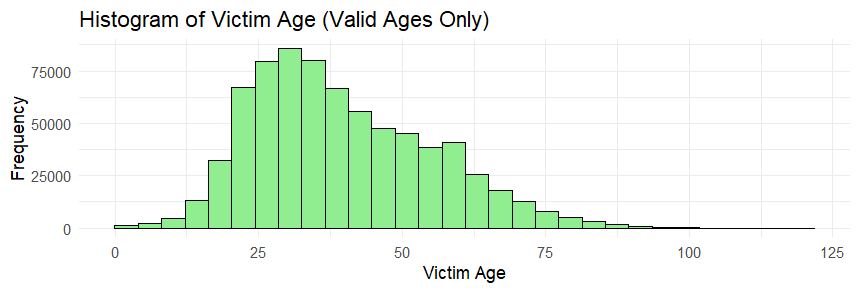
After clearing the invalid victim age values this was the obtained distribution of victim age.
The majority of ages cluster around 24-50 and the maximum values around 30 years old.
Figure 7. Histogram of time occurrence
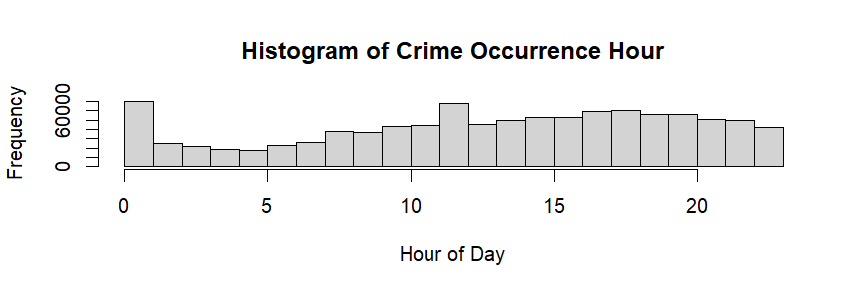
The time occurrence in the data set was in the format of HH:MM which needed to be converted to 24 hours for the analysis to be made.
The peak crime hours show at 12 AM and 11 PM and the lower rates after midnight.
Figure 8. Distribution of victim descent
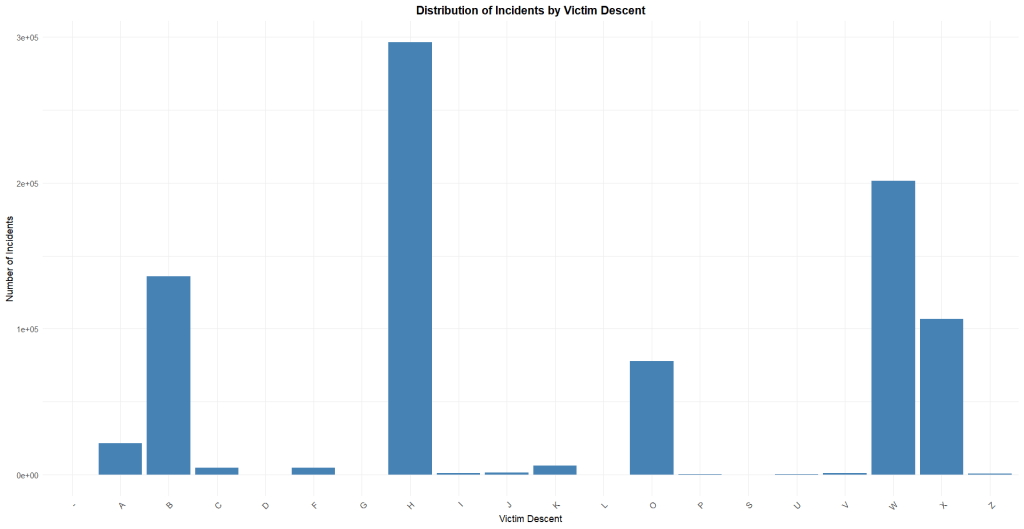
Figure 9. Weapon used by victim descent
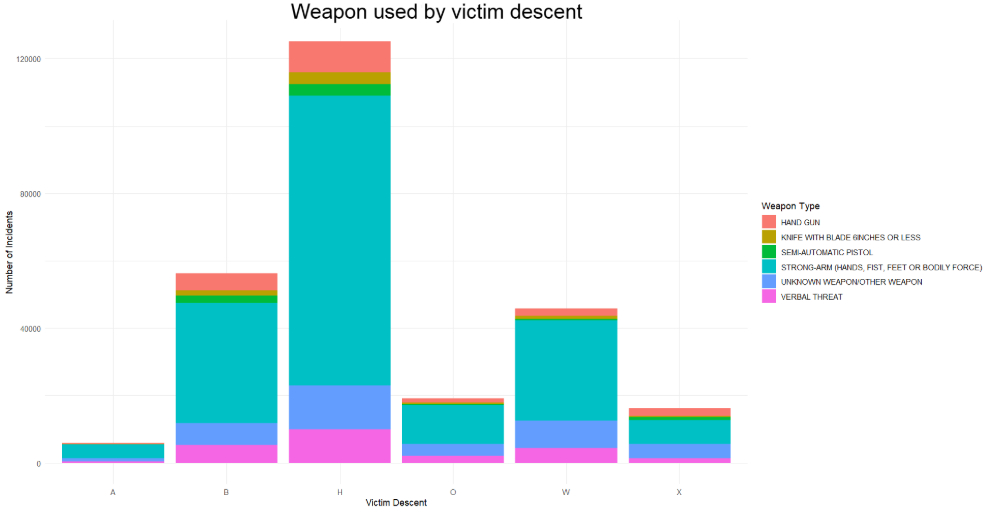
The majority of weapons that have been used with crimes no matter of the victim’s descent have slightly the same ratio, for strong arms such as usage of the body force being the most common weapon.
Figure 10. Weapon used by victim age
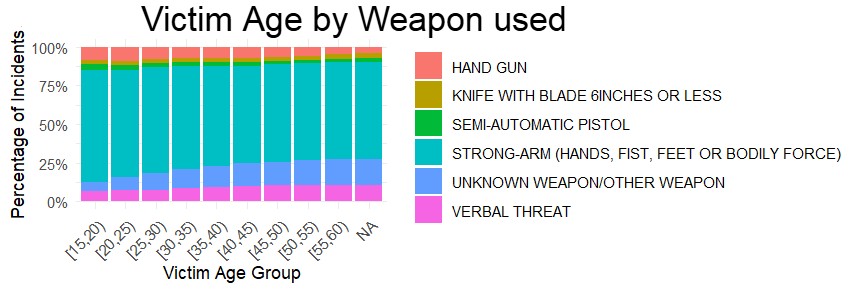
The same goes for the victim’s age, the most common weapon is STRONG-ARM .
Mean Time to Occurrence (MTTO) is a calculated mean related to time to show the average time between any consecutive incidents.
The time rate that had been used is in minutes and it was explicit for certain crimes and certain areas that will be explained in full depth below.
The MTTO for LAPD Crimes is this number “2.830205” means on average one incident occurs every ~2.83 minutes, ≈ 21 incidents per hour and ≈ 508 incidents per day.
However, for example; ARSON “criminal act of deliberately setting fire to property” occurs every 17.6 hours, ASSAULT WITH DEADLY WEAPON ON POLICE OFFICER every 40.1 hours, ASSAULT WITH DEADLY WEAPON, AGGRAVATED ASSAULT 51.1 minute, ATTEMPTED ROBBERY every 9 hours, BATTERY – SIMPLE ASSAULT every 36.5 minutes.
LAPD covers a population of approximately 4 million and the data set for all crime types, including minors, so an incident every 2–3 minutes citywide is expected.
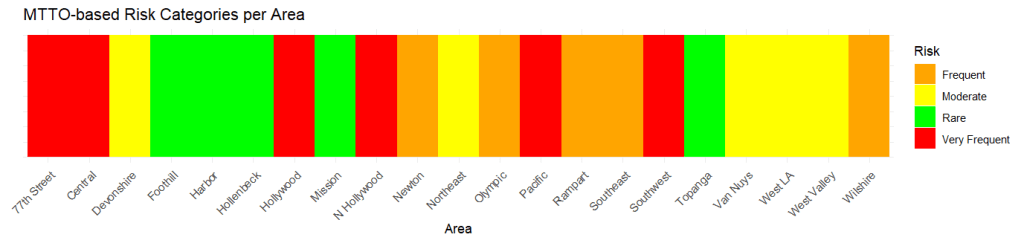
Figure 11. Area frequency based on MTTO for crimes
For example:
Table 1. Arson MTTO
| Crime Type | AREA NAME | MTTO_minutes |
| ARSON | 77th Street | 11855 |
| ARSON | Central | 11046 |
| ARSON | Mission | 22924 |
| ARSON | N Hollywood | 18010 |
| ARSON | Newton | 13680 |
Interpretation in words
- Lowest MTTO → most frequent incidents:
- Central (11,046 min) and 77th Street (11,855 min)
- Roughly 7–8 days between incidents → these are the hottest areas for arson.
- Moderate MTTO → occasional incidents:
- Hollywood, Hollenbeck, Mission, Newton → incidents every 12–16 days
- Highest MTTO → rare incidents:
- Devonshire (47,851 min ~ 33 days) → much less frequent
Another example
Table 2. Battery- simple assault MTTO
| Crime Type | AREA | MTTO_minutes |
| BATTERY – SIMPLE ASSAULT | 77th Street | 546 |
| BATTERY – SIMPLE ASSAULT | Central | 382 |
| BATTERY – SIMPLE ASSAULT | Devonshire | 1007 |
Figure 12. Vehicle stolen MTTO per Area
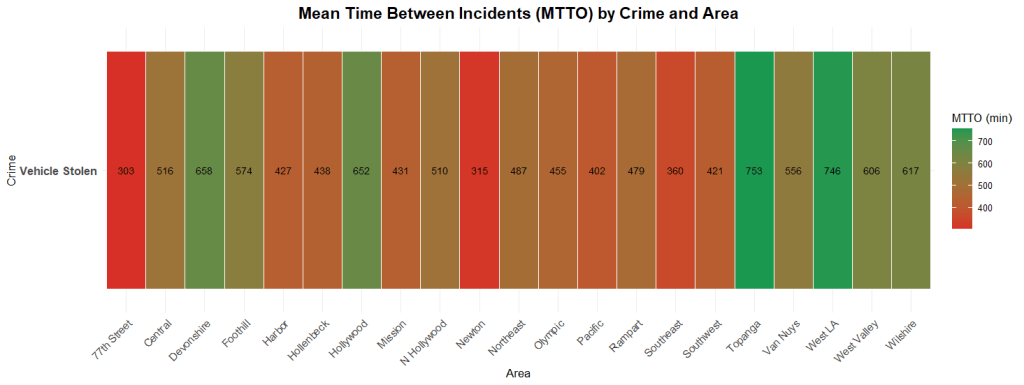
303 minutes in 77th Street between each vehicle stolen.
315 minutes in Newton between each vehicle stolen.
753 minutes in Topanga between each vehicle stolen recording the highest MTTO mean the biggest duration between each incidents of category “Vehicle stolen”
Figure 13. MTTO for most frequent crimes
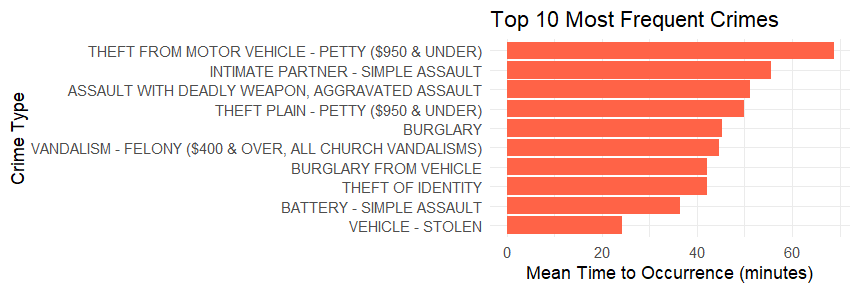
Note: This is the MTTO for all areas per each crime means it could record lower overall MTTO.
Figure 14. Heat Map
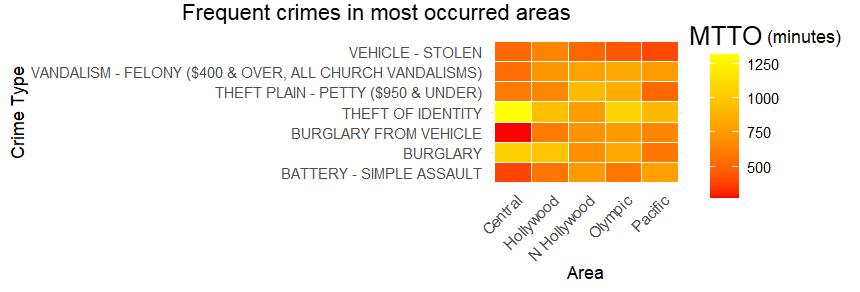
Figure 15. 4 Crimes MTTO per Area
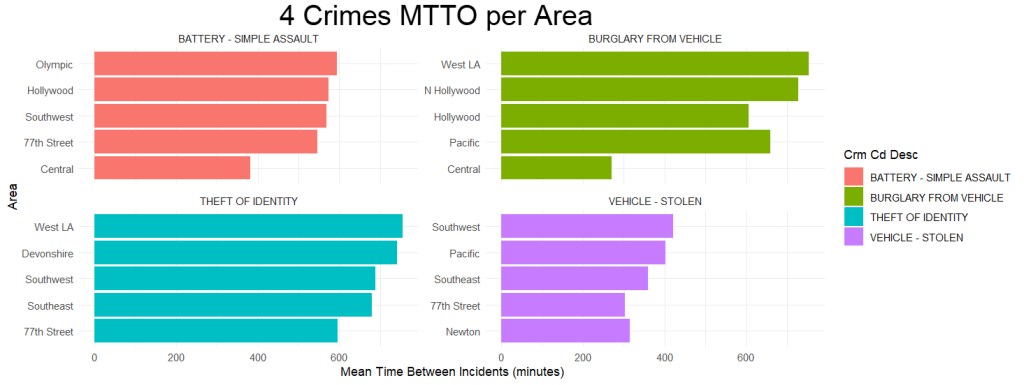
Figure 16. Crimes frequency in certain areas
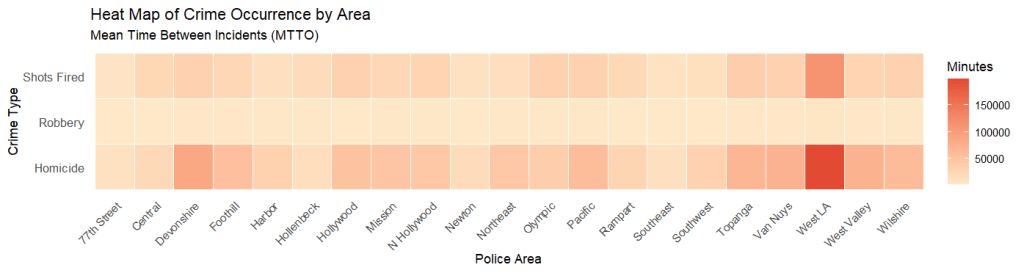
Figure 17. Battery simple assault MTTO by weekday
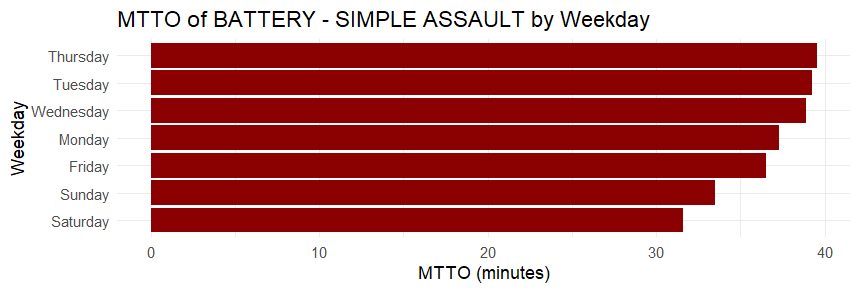
Figure 18. Assault on police officer MTTO by weekday
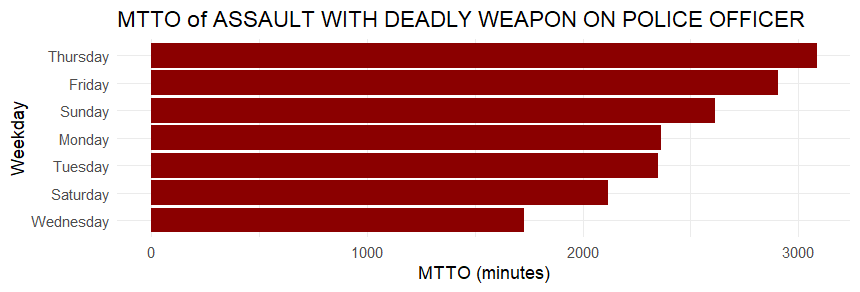
Figure 19. Pattern of 3 crimes by weekday
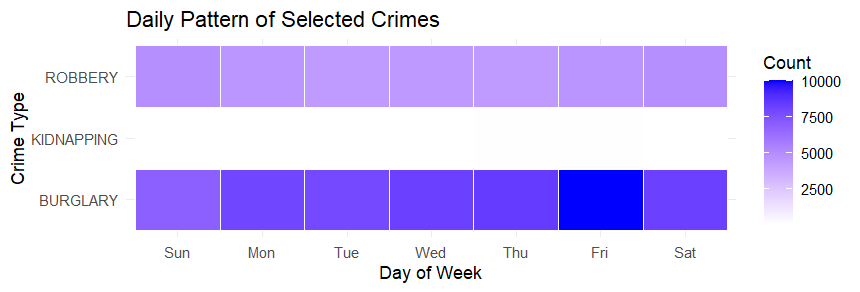
Figure 20. Pattern of 3 crimes by hour
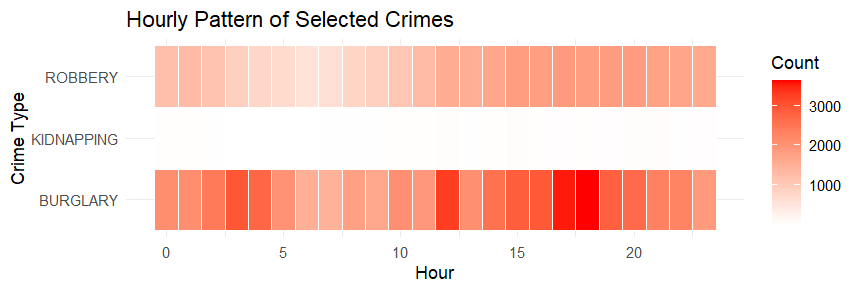
Table 3. Crime count
| Month | Crime | Count |
| January | Battery- Simple Assault | 6963 |
| February | Theft of Identity | 6100 |
| May | Vandalism- Felony | 5275 |
| August | Battery- Simple Assault | 6334 |
| October | Vehicle- Stolen | 10310 |
| December | Burglary from vehicle | 5510 |
Note: The full table listed most 3 crimes count for each month in order but the shown table listed one of the most 3 crimes in some months not in order to implicate differences between the crimes since a lot of crimes listed as the most for more than one month.
Crime vehicle-stolen was excluded from the table; simply because per each month of the year (from January until December) it recorded the most count of all crimes with 9000 count approximately for each month except july, august and october 10000 count approximately.
One Vehicle- Stolen was written just to show. That was the highest count of all months.
Table 4. Certain crimes characteristic
| Crime Type | Area Name | Total Incidents | Avg Victim Age |
| ASSAULT WITH DEADLY WEAPON, AGGRAVATED ASSAULT | 77th Street | 5567 | 37.1 |
| BATTERY – SIMPLE ASSAULT | Central | 6705 | 40.9 |
| BATTERY – SIMPLE ASSAULT | 77th Street | 4646 | 40.0 |
| BURGLARY | Pacific | 3178 | 46.5 |
| BURGLARY FROM VEHICLE | Central | 9463 | 34.9 |
| BURGLARY FROM VEHICLE | Hollywood | 4278 | 36.1 |
Figure 21. Burglary and Robbery most frequent Areas
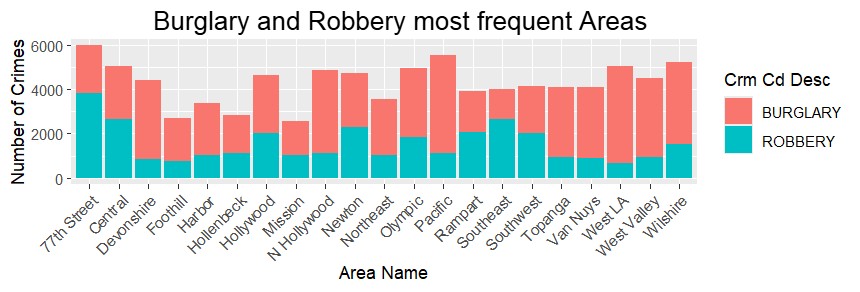
Figure 22. 3 crimes count by hour
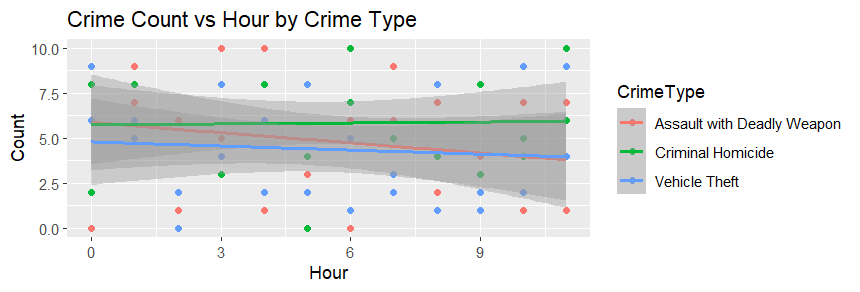
Table 5. Crime percentages of occurrence for only the month January with day
| Day Of Week | Crime | Total Incidents | Percentage |
| Friday | BATTERY – SIMPLE ASSAULT | 980 | 11.2 |
| Monday | THEFT OF IDENTITY | 1180 | 13.6 |
| Friday | BURGLARY | 957 | 11.0 |
| Saturday | BURGLARY FROM VEHICLE | 972 | 7.26 |
| Saturday | VANDALISM – FELONY ($400 &…) | 840 | 10.0 |
| Sunday | THEFT PLAIN – PETTY ($950 … | 550 | 6.43 |
| Sunday | ASSAULT WITH DEADLY WEAPON… | 783 | 9.16 |
| Sunday | INTIMATE PARTNER – SIMPLE ASSAULT | 826 | 9.66 |
| Monday | THEFT FROM MOTOR VEHICLE – | 584 | 6.72 |
| Sunday | THEFT FROM MOTOR VEHICLE – | 540 | 6.31 |
Table 6. Random Crimes percentages of occurrence for months by day
| Month | Day Of Week | Crime | Total Incidents | Percentage |
| June | Saturday | VEHICLE – STOLEN | 1458 | 20.6 |
| February | Wednesday | THEFT OF IDENTITY | 1229 | 15.8 |
| March | Saturday | BATTERY-SIMPLE ASSAULT | 988 | 13.2 |
| May | Saturday | Burglary | 862 | 11.1 |
| July | Friday | ASSAULT WITH DEADLY WEAPON | 731 | 8.47 |
| August | Sunday | ASSAULT WITH DEADLY WEAPON | 791 | 10.8 |
| July | Wednesday | BATTERY-SIMPLE ASSAULT | 856 | 12 |
Of course Vehicle-Stolen recorded the highest of all months but crime were chosen to add diversity.
Links for public Scatter Maps done for certain crimes
Map distribution for battery, burglary, criminal homicide, kidnapping, extortion, robbery and vehicle stolen
https://rpubs.com/OmarIbrahim98/1384483
MAP FOR CRIMINAL HOMICIDE WITH HOUR
https://rpubs.com/OmarIbrahim98/HOMICIDE-HOUR-DARK
MAP FOR THEFT PETTY WITH HOUR
https://rpubs.com/OmarIbrahim98/THEFT-PETTY-HOUR
MAP FOR GRAND THEFT WITH HOUR
https://rpubs.com/OmarIbrahim98/GRAND-THEFT
ALL 3 COMBINED WITH HOUR “Grand theft, Petty theft and Criminal homicide”
https://rpubs.com/OmarIbrahim98/ALL-3-COMBINED
Conclusion
The given research suggest that there’s no obvious patterns for crimes, although there exist some relations.
For consideration, the research could had faced some limitation for inconsistency or missing values of data.
References
Data.gov. (2025, November 29th). Crime Data from 2020 to Present. https://catalog.data.gov/dataset/crime-data-from-2020-to-present Last retrieved. (9-12-2025)
Ire Alarape; Eyob Dagnachew & Tchegnon Adjagbodjou. (2024, December 9th). Crime Patterns across Los Angeles’ LAPD Divisions. https://tinyurl.com/3fr337m7 Last retrieved. (9-12-2025)
LAPF Foundation. About LAPD. https://supportlapd.org/about-lapd/ Last retrieved. (9-12-2025)
US Facts. (2025, November 26th). Which states have the highest and lowest crime rates? https://tinyurl.com/4j879v4b Last retrieved. (9-12-2025)
World Population Review. (2025). Crime Rate by State 2025. https://worldpopulationreview.com/state-rankings/crime-rate-by-state Last retrieved. (9-12-2025)
Justice Center. (2024). 50-State Crime Data. https://tinyurl.com/4v3c7czy Last retrieved. (9-12-2025)
Open Data Bay. (2025, October 7th). LAPD Reported Crime Data Public Safety & Security. https://tinyurl.com/yr4by9s5 Last retrieved. (9-12-2025)
Open Data Bay. (2025, September 24th). LAPD Crime Incident Reports Geocoded. https://tinyurl.com/34yzury5 Last retrieved. (9-12-2025)
FBI. (2012). Offense Definitions. https://tinyurl.com/ndmd4su6 Last retrieved. (9-12-2025)
FBI. (2014). Offense Definitions. https://tinyurl.com/4x8eah8e Last retrieved. (9-12-2025)
